The toolbar controls use the English labels below. Most actions operate on the last selected range; comments apply to the active cell.
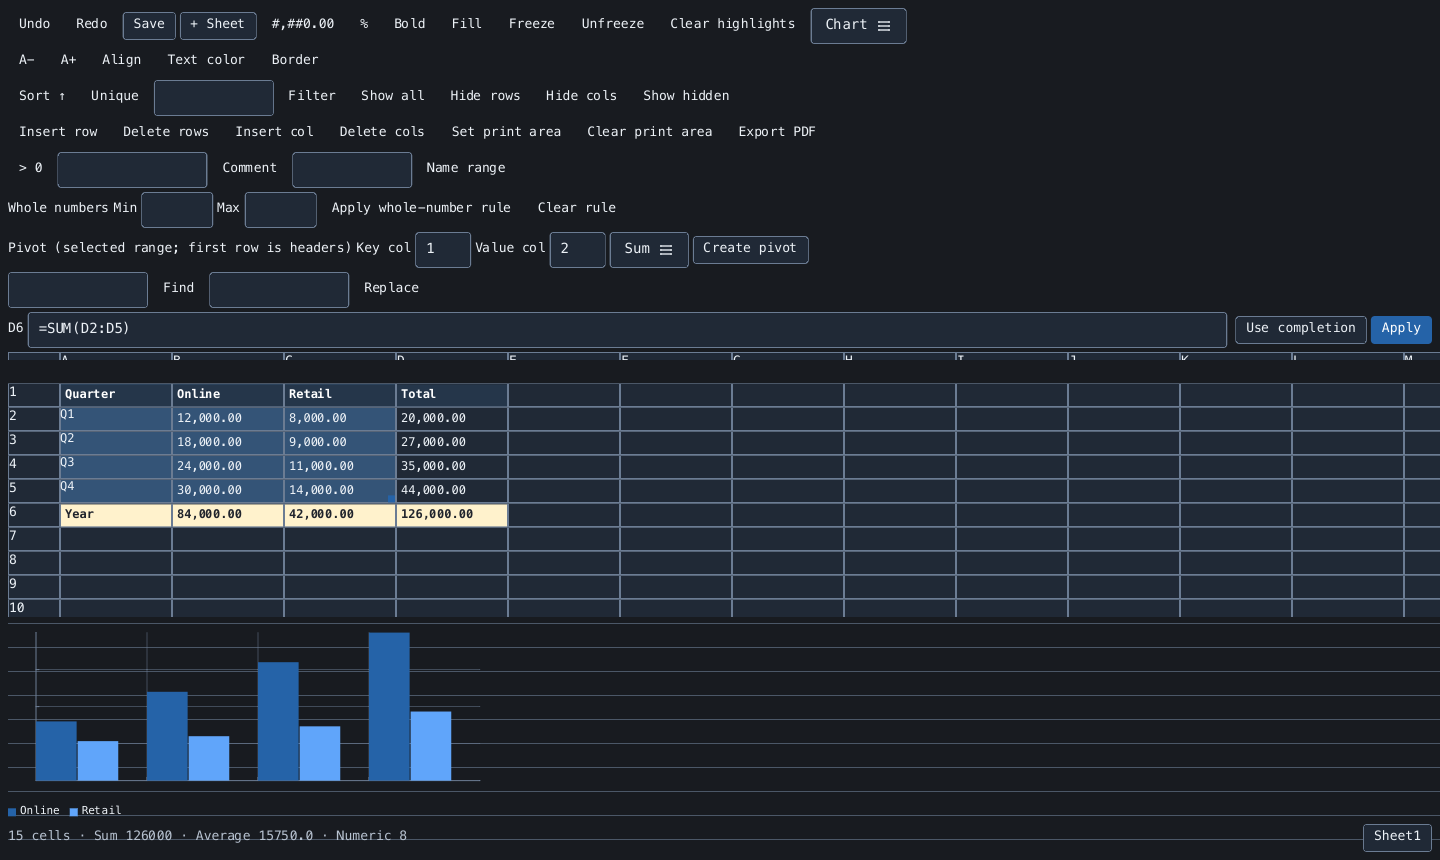
The real editor, rendered with synthetic sales data.
- Select and edit cells
- Format and arrange a sheet
- Sort, filter, and remove duplicates
- Find, replace, and annotate
- Validate whole-number inputs
- Create a static pivot
- Draw a chart
- Sheets and keyboard controls
Select and edit cells
Click a cell and use arrow keys to move through the grid. Shift-click extends a selection; Ctrl-click or Cmd-click adds another selection. Drag the small fill handle at the lower-right corner of a selected range to repeat its inputs into neighboring cells. Relative formula references adjust as they are filled.
Double-click or press Enter to start an inline edit. Enter commits and Escape
cancels. The formula bar shows the stored input, including the leading = for
a formula, while the grid shows its calculated result. Choose Apply to
commit the formula bar. A blank input clears the cell.
Select a range to see its count, numeric count, sum, and average in the status bar. Error messages also appear there. An invalid formula or input-validation failure leaves an inline edit open so you can correct it or press Escape.
Format and arrange a sheet
| Control | Effect on the selection |
|---|---|
| #,##0.00 | Show numbers with grouping and two decimal places. |
| % | Show numbers as percentages with two decimal places. |
| Bold | Toggle bold using the active cell’s current setting. |
| Fill | Apply a pale yellow background. |
| A− / A+ | Decrease or increase font size, from 6 to 72. |
| Align | Cycle left, center, and right alignment. |
| Text color | Apply red text. |
| Border | Apply a gray cell border. |
| > 0 | Highlight positive values in green. |
| Clear highlights | Remove all conditional rules from the active sheet. |
These buttons apply preset styles. The workbook API offers additional number formats, colors, font families, and conditional operators.
Freeze keeps rows and columns through the active cell visible as you scroll. Unfreeze removes frozen panes. Hide rows and Hide cols hide selected rows or columns; Show hidden reveals them and clears the current filter.
Insert row and Insert col insert one row or column before the selection. Delete rows and Delete cols delete all selected rows or columns. Structural edits adjust supported formula references and workbook metadata.
Sort, filter, and remove duplicates
- Sort ↑ / Sort ↓: sort the selected rectangle by its leftmost column. The direction alternates after each sort. Exclude a header row from the selection when you want to keep it in place.
- Filter: enter text in the filter field and select a range. Rukbat checks the range’s leftmost column using a case-insensitive substring match and hides nonmatching rows within that range. Show all clears the filter; explicitly hidden rows remain hidden.
- Unique: compare calculated values across the selected columns, keep the first occurrence of each row, and delete later duplicate rows. This deletes entire sheet rows, including cells outside the selected columns. Use Undo to reverse it.
Filtering changes visibility; hidden and filtered rows still belong to the workbook and are included in CSV/TSV export.
Find, replace, and annotate
Select a range, enter search text, and choose Find to select matching cells. Find checks both stored inputs and calculated values, ignoring case. It changes the selection, so reselect the intended range before a later replacement.
Replace replaces all matching substrings in stored string inputs within the selection. Replacement is case-sensitive and can change formula text. Invalid formulas reject the operation without partially replacing the range.
Enter a comment and choose Comment to attach it to the active cell. Selecting that cell again loads its comment into the field. Save an empty comment to remove it. To name a range, select it, enter a name, and choose Name range. See named ranges for formulas that use it.
Validate whole-number inputs
Select a range, enter inclusive Min and Max bounds under Whole numbers, then choose Apply whole-number rule. Nonblank edits must evaluate to whole numbers within those bounds; a formula’s result is checked too. Blank cells remain allowed. Adding a rule does not change existing values.
Clear rule removes validation from the selected area. Validation follows row and column edits and supports undo/redo. It is not saved in CSV/TSV.
Create a static pivot
Select a rectangle including its header row. Set Key col and Value col to one-based column positions within that selection, choose Sum or Count, then choose Create pivot.
For this selection, use key column 1 and value column 2:
| Region | Sales |
|---|---|
| East | 10 |
| West | 4 |
| East | 6 |
The generated Pivot sheet contains East / 16 and West / 4. Groups preserve
first-seen order and match exact key values. Sum accepts finite real numbers;
Count counts nonblank values. Formula results are used for both keys and values.
The result is a static snapshot: later source edits do not refresh it.
Repeated pivots use the next available name, such as Pivot2. One Undo removes
the generated sheet. The source sheet stays active; click the pivot sheet tab
before saving if you want to export its summary.
Draw a chart
Select a range including its headers, then choose a type from Chart: Line, Bar, Pie, Donut, Scatter, Area, Stacked area, or Stacked bar.
- For line, bar, and area charts, the first column of a multi-column selection is treated as labels; remaining columns become numeric series.
- For pie and donut charts, the first column supplies labels and the second supplies values. A single-column selection uses row numbers as labels.
- For scatter charts, select a numeric X column and at least one numeric Y column. A leading nonnumeric label column is skipped.
Include at least one data row below the headers. Charts are built from the selection when you choose the chart type; choose it again to rebuild after editing data. Charts are not saved in CSV/TSV or rendered in PDF output.
Sheets and keyboard controls
Choose + Sheet to add and activate a sheet. Click a sheet tab in the status bar to switch sheets. Each sheet has its own formatting, visibility, and frozen panes. Switching sheets clears the current filter.
| Action | Shortcut |
|---|---|
| Move through the grid | Arrow keys |
| Start / commit an inline edit | Enter |
| Cancel an inline edit | Escape |
| Save the active sheet | Ctrl+S / Cmd+S |
| Undo a workbook change | Ctrl+Z / Cmd+Z |
| Redo a workbook change | Ctrl+Shift+Z / Cmd+Shift+Z |
Workbook undo/redo shortcuts defer to text-field editing while a text field has focus. Use the toolbar Undo and Redo buttons for workbook history in that situation. Desktop and terminal interaction depends on the selected Zaniah backend; the command line does not provide a backend-selection flag.